← All solutionsMacro and policy research
Find the macro chart. Check the release context.
Search the current FRED visual corpus for macroeconomic charts, then inspect the source and available series context before using a result.
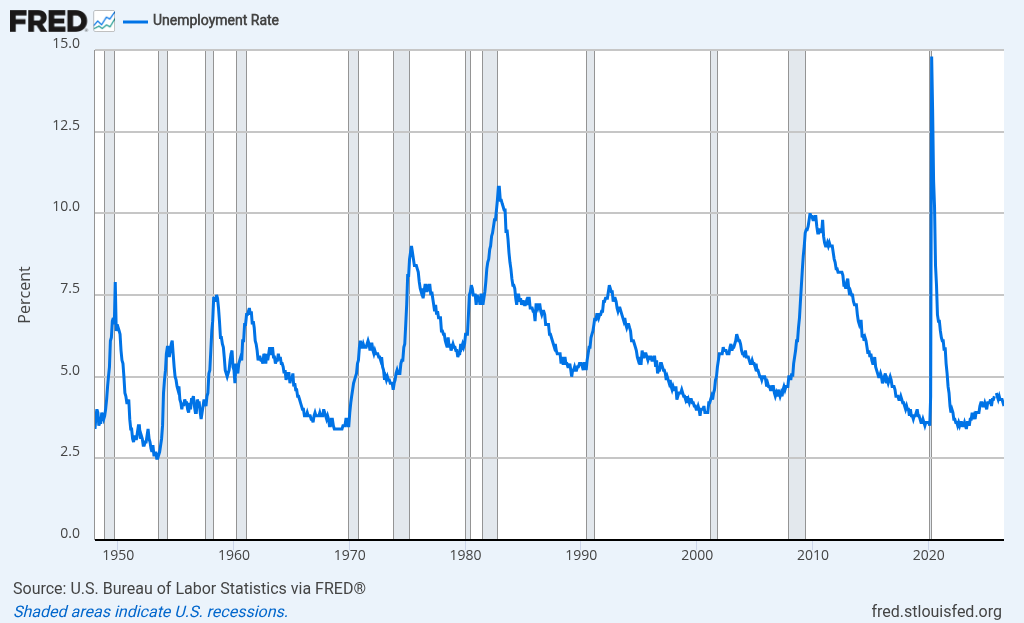
U.S. unemployment rateFRED series · UNRATE · percent
- Publisher
- Federal Reserve Bank of St. Louis · FRED
- Record
- Unemployment Rate · series UNRATE
- Rights recorded
- Public domain; citation requested
Check the series definition, observation period, and seasonal adjustment in FRED; historical release vintages are not fully captured.
The workflow problem
A number without its series, period, and release context can mislead. Rebuilding charts from raw data can also hide the original source and presentation.
A workflow to evaluate
- Search for an indicator, trend, or comparison.
- Review the returned FRED chart and its linked source/data context.
- Confirm the observation period and release vintage independently.
- Use the visual only when its source and period fit the research question.
Current product coverage
What is available—and what is not.
Available to search: selected native FRED charts, BLS, CBO, and Treasury Fiscal Data.
BEA and ALFRED are not currently included as searchable sources.
Important limitation
Historical-vintage capture is not complete. Evidence API does not guarantee the latest release, a specific historical vintage, or exhaustive macro-source coverage.
Next step
Test with a real question from your workflow.
Try the available sources. If you need additional coverage, tell us which sources and workflow to evaluate.