2025 publication edition, Exhibit 2.4
Metric: energy demand growth · Period: 2024 to 2030, forecast · Units: EJ, harmonised · Edition: 2025. Metric, period, units, and edition all match before the image is opened.
Evidence is the verified index of published visuals, charts, tables, maps and figures from filings, central banks, agencies and publishers. Every result is one real visual, described in rich metadata, checked against its source, and cleared to show and cite.
Free metadata search · No card to try · API + MCP in minutes · If there’s no verified match, we say so, we don’t fill the gap with a remake.
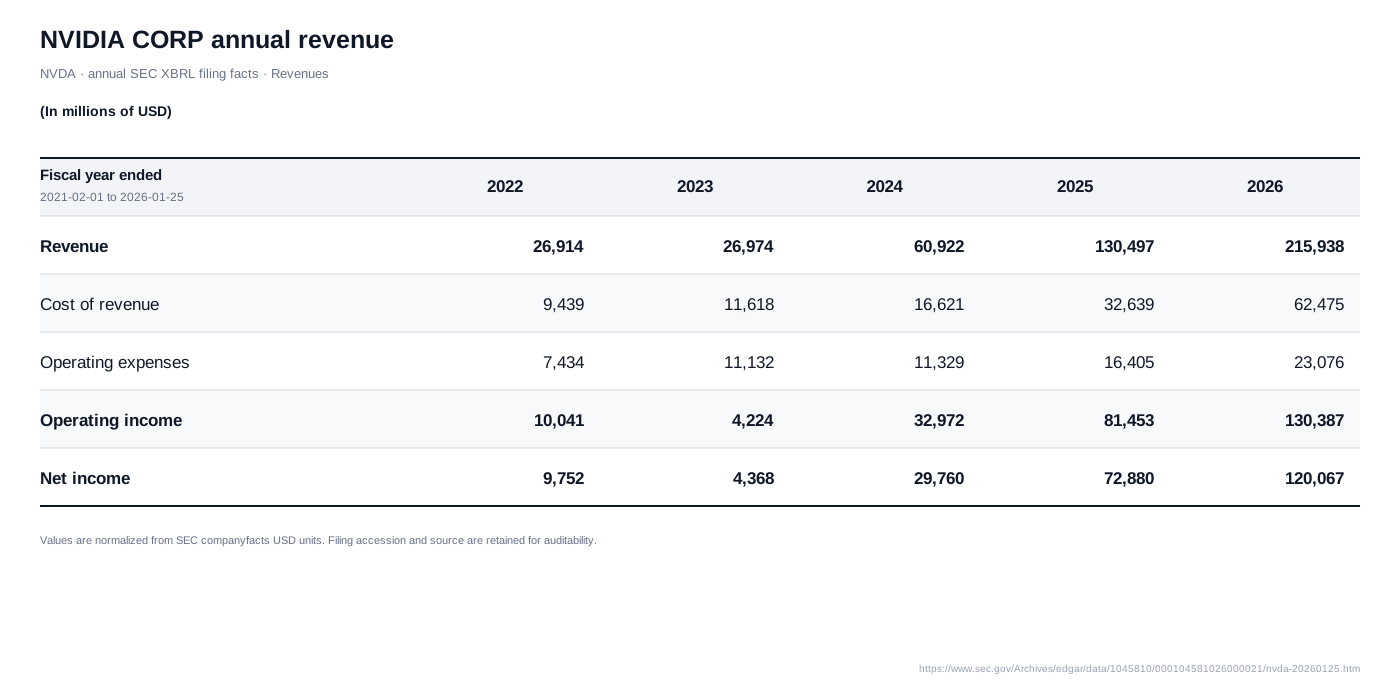
This table is derived from SEC companyfacts, not an original chart in the filing. Check the fiscal periods and reported facts in the 10-K.
Real record from the current index · filing-derived table from SEC companyfacts, not an original chart published in the filing · latest indexed Form 10-K filed February 25, 2026
Tell Evidence the metric, the period, the units, and the publication edition. Different editions stay separate, so a 2024 forecast and a 2025 forecast for the same years do not get mixed together.
Search pattern example only. These three cards show how edition separation works; they are not live results.
One visual. One record you can check. Switch tabs to see its metadata, its verification, and its rights and citation. The record below is the real NVIDIA record from the hero, with its fields as the repo carries them.
| What it measures | NVIDIA annual revenue |
| Period | Annual periods |
| Units | Millions of USD |
| Edition | Not recorded |
| Geography | Not recorded |
| Publisher | U.S. Securities and Exchange Commission |
| Document | NVIDIA CORP latest 10-K |
| Record | NVIDIA Corporation · latest indexed Form 10-K · filed February 25, 2026 |
| Evidence asset | asset_sec_nvda-annual-revenue |
| Linked data | Not recorded |
If a field is not recorded, the record says so. A search with no match says so, instead of returning a close but wrong visual.
Written for three jobs, not for generic teams.
Build research agents that return a published visual with its source, period, edition, and rights, so a reviewer can check it before it is used.
Try a search →Put the exact exhibit in a memo or deck, with a citation a reviewer can trace to the page in one click.
Try a search →Research teams find the published visual and cite you, with your source link attached. Publisher terms are set per visual. Display fees, where they apply, are publisher-priced.
Contact us →Metadata search is free on every plan. You pay for verified retrievals, and licensed display is publisher-priced on top. A search with no match costs nothing.
$0 / mo
USD / month
$49 / mo
USD / month
$249 / mo
USD / workspace / month
Custom
Billing: Monthly
Sizing estimate, not a quote. Licensed display has no single rate, each visual is priced by its publisher, so this uses a $0.25 example average only to size a month. Your actual display cost is the sum of the publisher prices for the visuals you actually show.
RECOMMENDED PLAN
Builder — $49/mo
$99 / mo estimated
Plan $49 + licensed display $50 (at the $0.25 example average, not a charged rate). Retrievals within the recommended plan allowance.
Prices in USD. Metadata search is included on every plan and does not count against your retrieval allowance. A retrieval counts once, when a verified record is returned. A search with no match costs nothing. Builder and Discover are per account; Research Team is priced per workspace.
These are the six views in the workspace.
Search the index by metric, period, units, and edition, and open a record to check it.
Keep the records you retrieved, with their source and rights beside each one.
Group records into collections for a project, memo, or product.
See the publishers and corpora in the index, with the rights recorded for each.
See how your workspace is using retrieval, in one place.
Manage your workspace, members, and access.
Sign in to open your workspace, or create an account to start with Discover.
After signing in, you see your own workspace.
These are examples from the current index. Coverage is selective; check the full source catalog for available publishers and records.
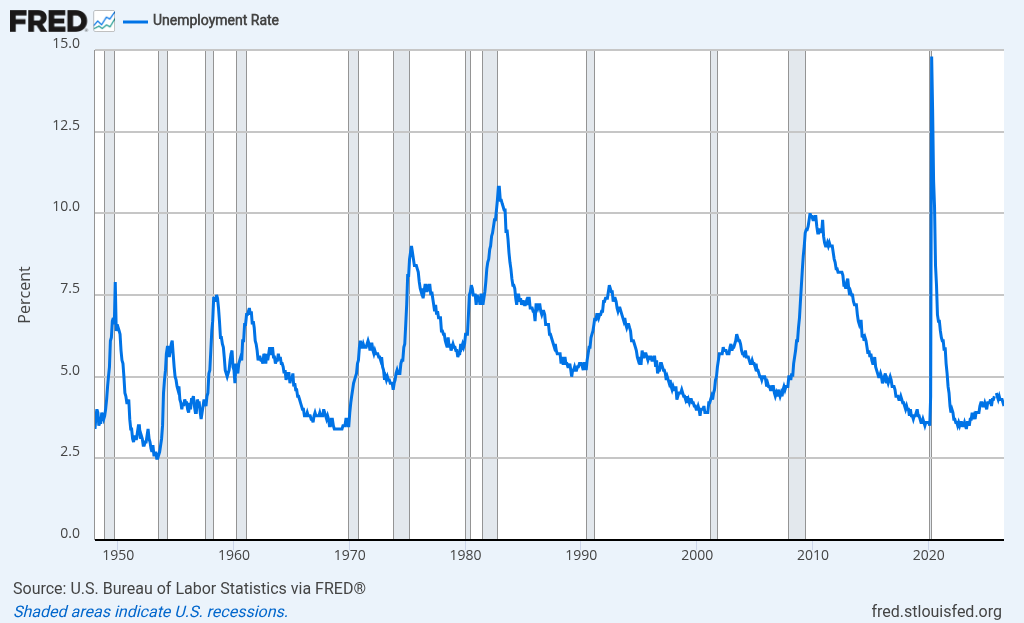
Selected native FRED charts with linked series and source context.
124 indexed recordsAvailable to searchSEC filing visualsSelected charts derived from filing facts, linked back to the filing.
12 indexed recordsAvailable to searchCompany investor relations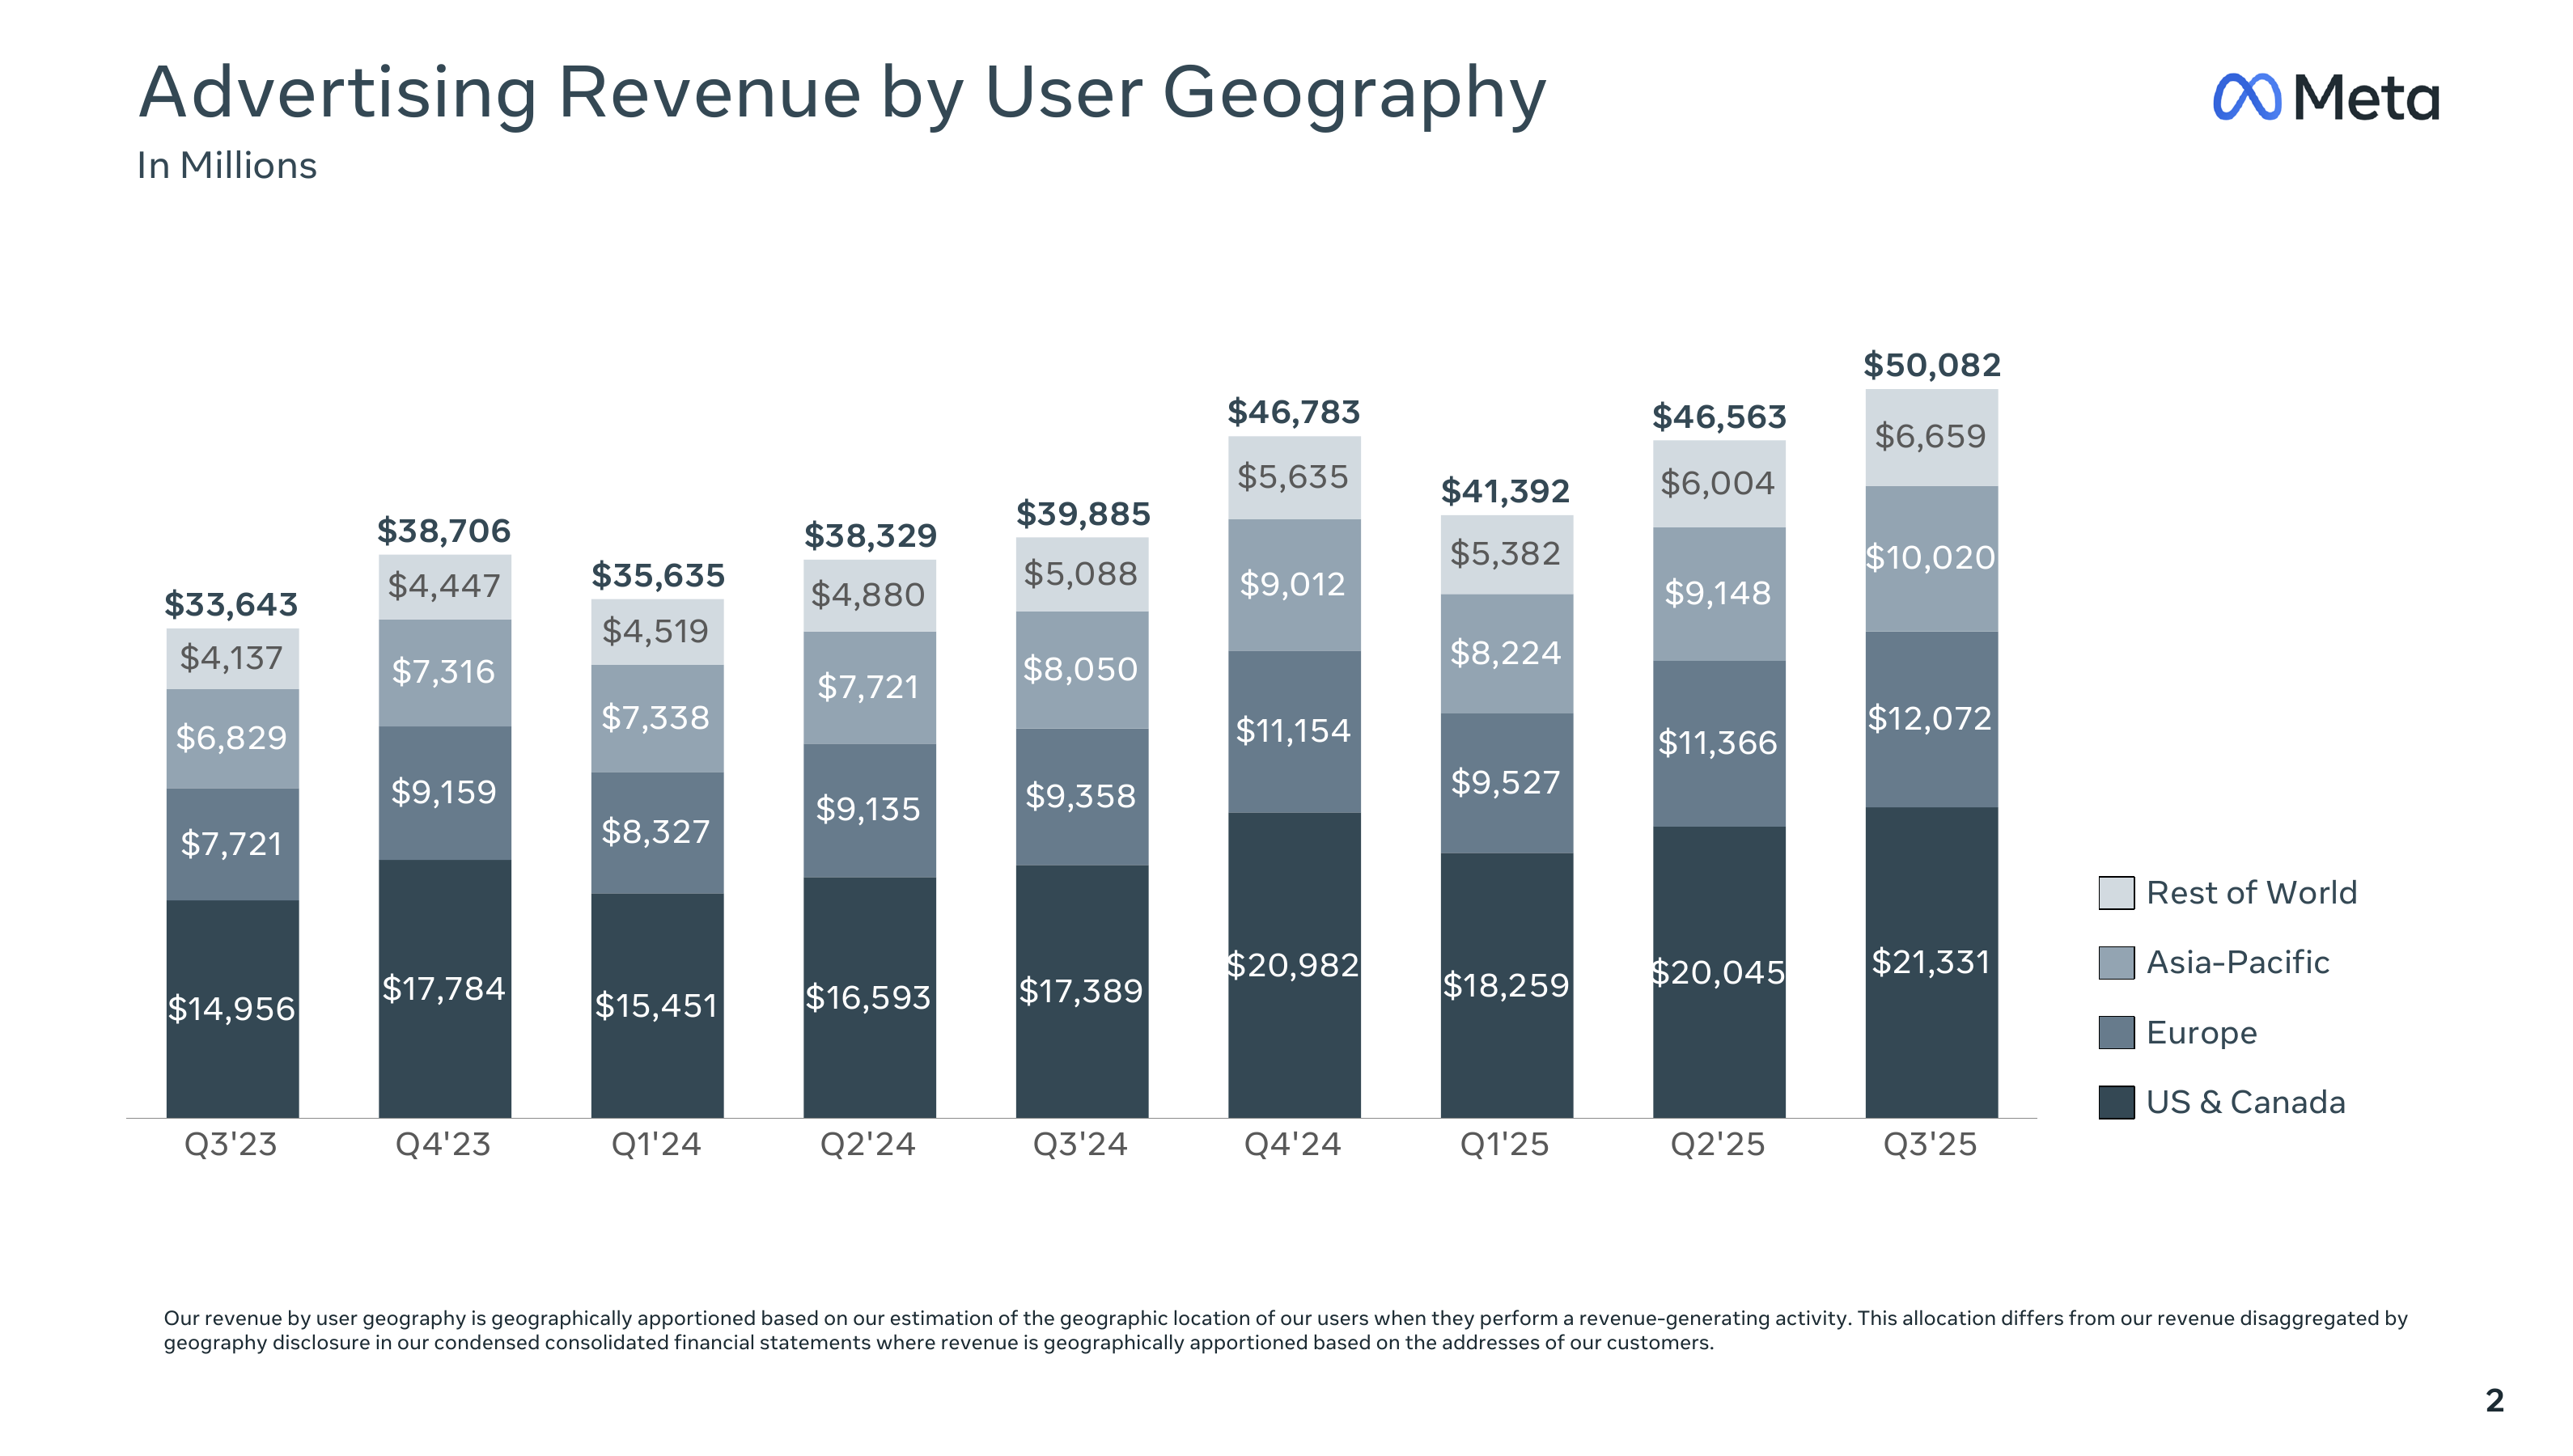
Visual pages from a small set of official investor-relations PDFs.
13 indexed recordsselective coverage · record counts come from the current index
Charts, tables, figures and maps from indexed sources. Each result is one published visual, with its publisher and document, the page or series it came from, and a link to the original source.
Search the public index first and inspect a real result before you integrate. Start with the free Discover plan.