← All solutionsFinancial research software
Give financial AI a source it can show.
Help analysts and AI agents find public charts, filing-derived comparisons, and research visuals with the source and available context beside them.
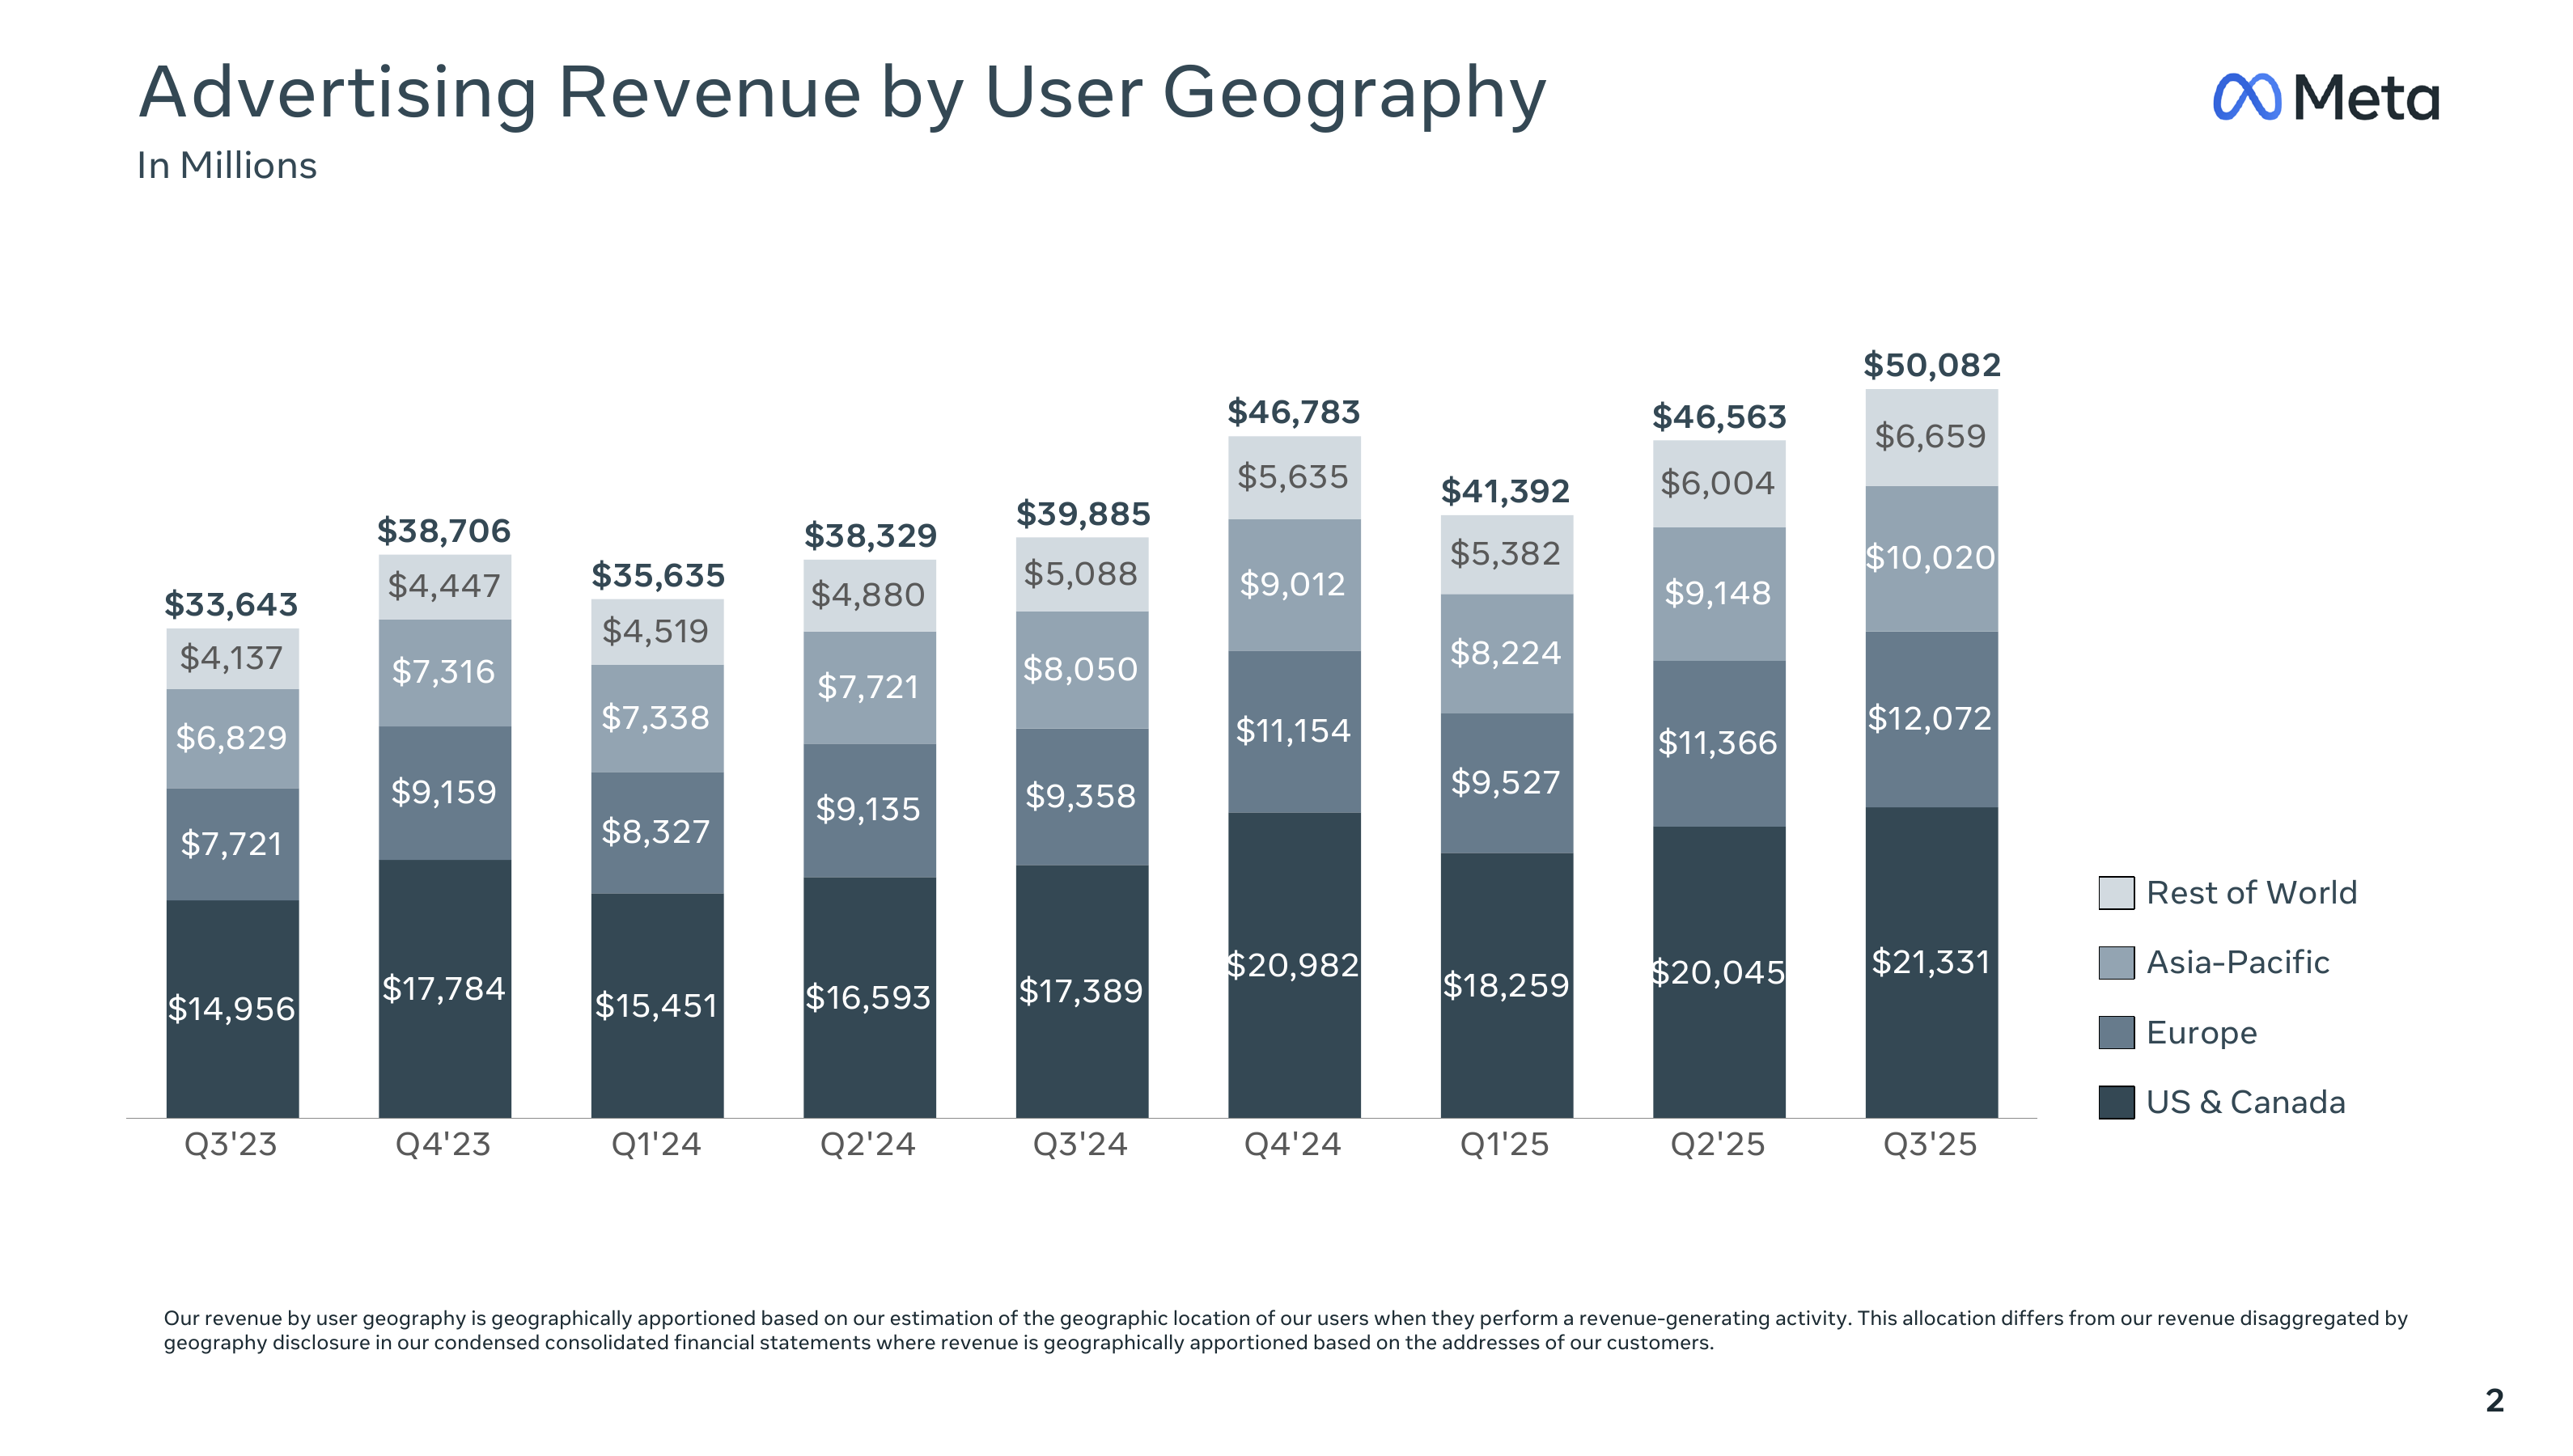
Advertising revenue by user geographyQuarterly revenue · millions of USD
- Publisher
- Meta Investor Relations
- Record
- Meta Q3 2025 Earnings Presentation · page 2
- Rights recorded
- Source-hosted; verify issuer terms
Compare the reported periods and regional definitions in the original presentation before reusing the chart.
The workflow problem
Research answers often have a text citation but not the visual that explains the trend, period, or comparison. Teams then search, verify, and paste evidence by hand.
A workflow to evaluate
- An analyst asks a question inside a research product.
- The product searches its available evidence for a relevant visual.
- The analyst checks the source, date, and rights context before using it.
- The product embeds the reviewed evidence in its research workflow.
Current product coverage
What is available—and what is not.
FRED: selected native charts available to search.
SEC Filing Visuals: charts derived from selected SEC filing facts.
Company Investor Relations: visual pages from selected official PDFs.
Important limitation
Search is limited to the indexed sources available today. Coverage is not exhaustive, retrieval does not verify meaning, and service-level commitments are not included.
Next step
Test with a real question from your workflow.
Try the available sources. If you need additional coverage, tell us which sources and workflow to evaluate.