Builds a chart from reported revenue figures.
The filing has a revenue table; its embedded graphic is a stock chart.
Finds charts from different publishers and year ranges. Someone still checks which fits.
Stop generating charts. Retrieve them.
Evidence API returns ranked charts, tables, maps, and figures from indexed sources, with source and available period details attached. Your analyst can review the match before it goes into the answer.
For: product leaders, heads of research or data, and AI-platform owners at financial research and market-intelligence software companies.
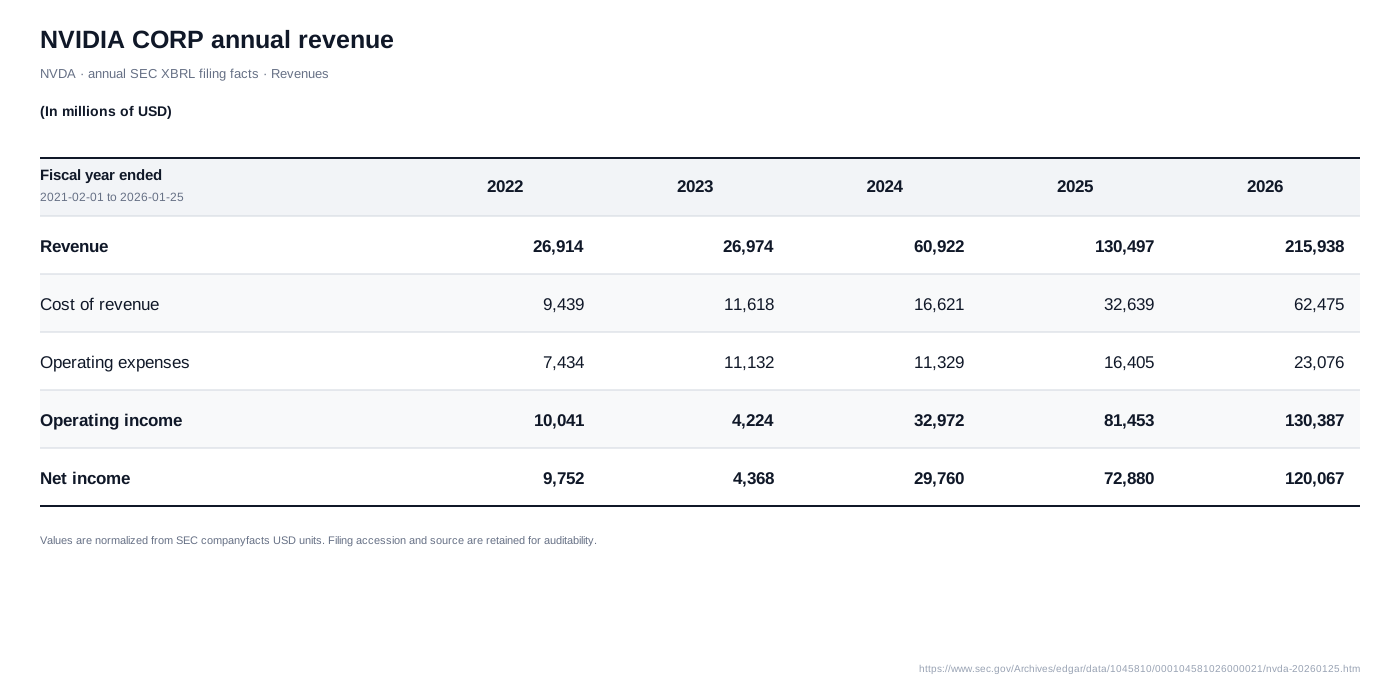
Find NVIDIA annual revenue in its latest SEC filing.
Same question, two workflows: “Annual revenue chart from NVIDIA SEC filing.”
Builds a chart from reported revenue figures.
The filing has a revenue table; its embedded graphic is a stock chart.
Finds charts from different publishers and year ranges. Someone still checks which fits.
Without an index, an agent checks candidate images one by one. Evidence searches indexed visual descriptions and source context first, so the model can focus on a shortlist.
Coverage is selective. Sources not listed here are not currently searchable.

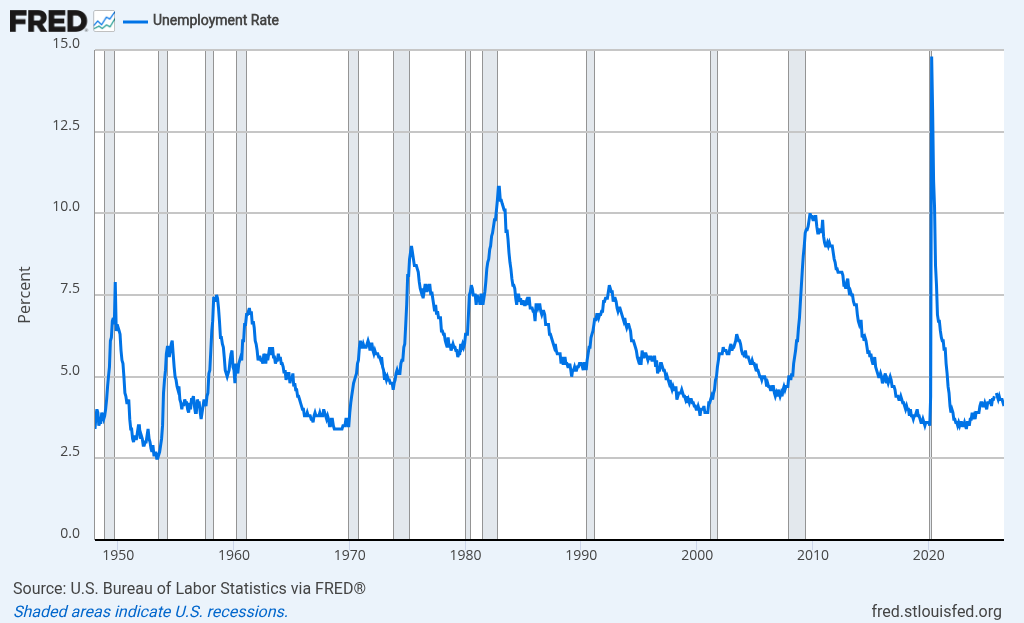
Selected native FRED charts with linked series and source context.
124 indexed recordsAvailable to searchSEC filing visualsSelected charts derived from filing facts, linked back to the filing.
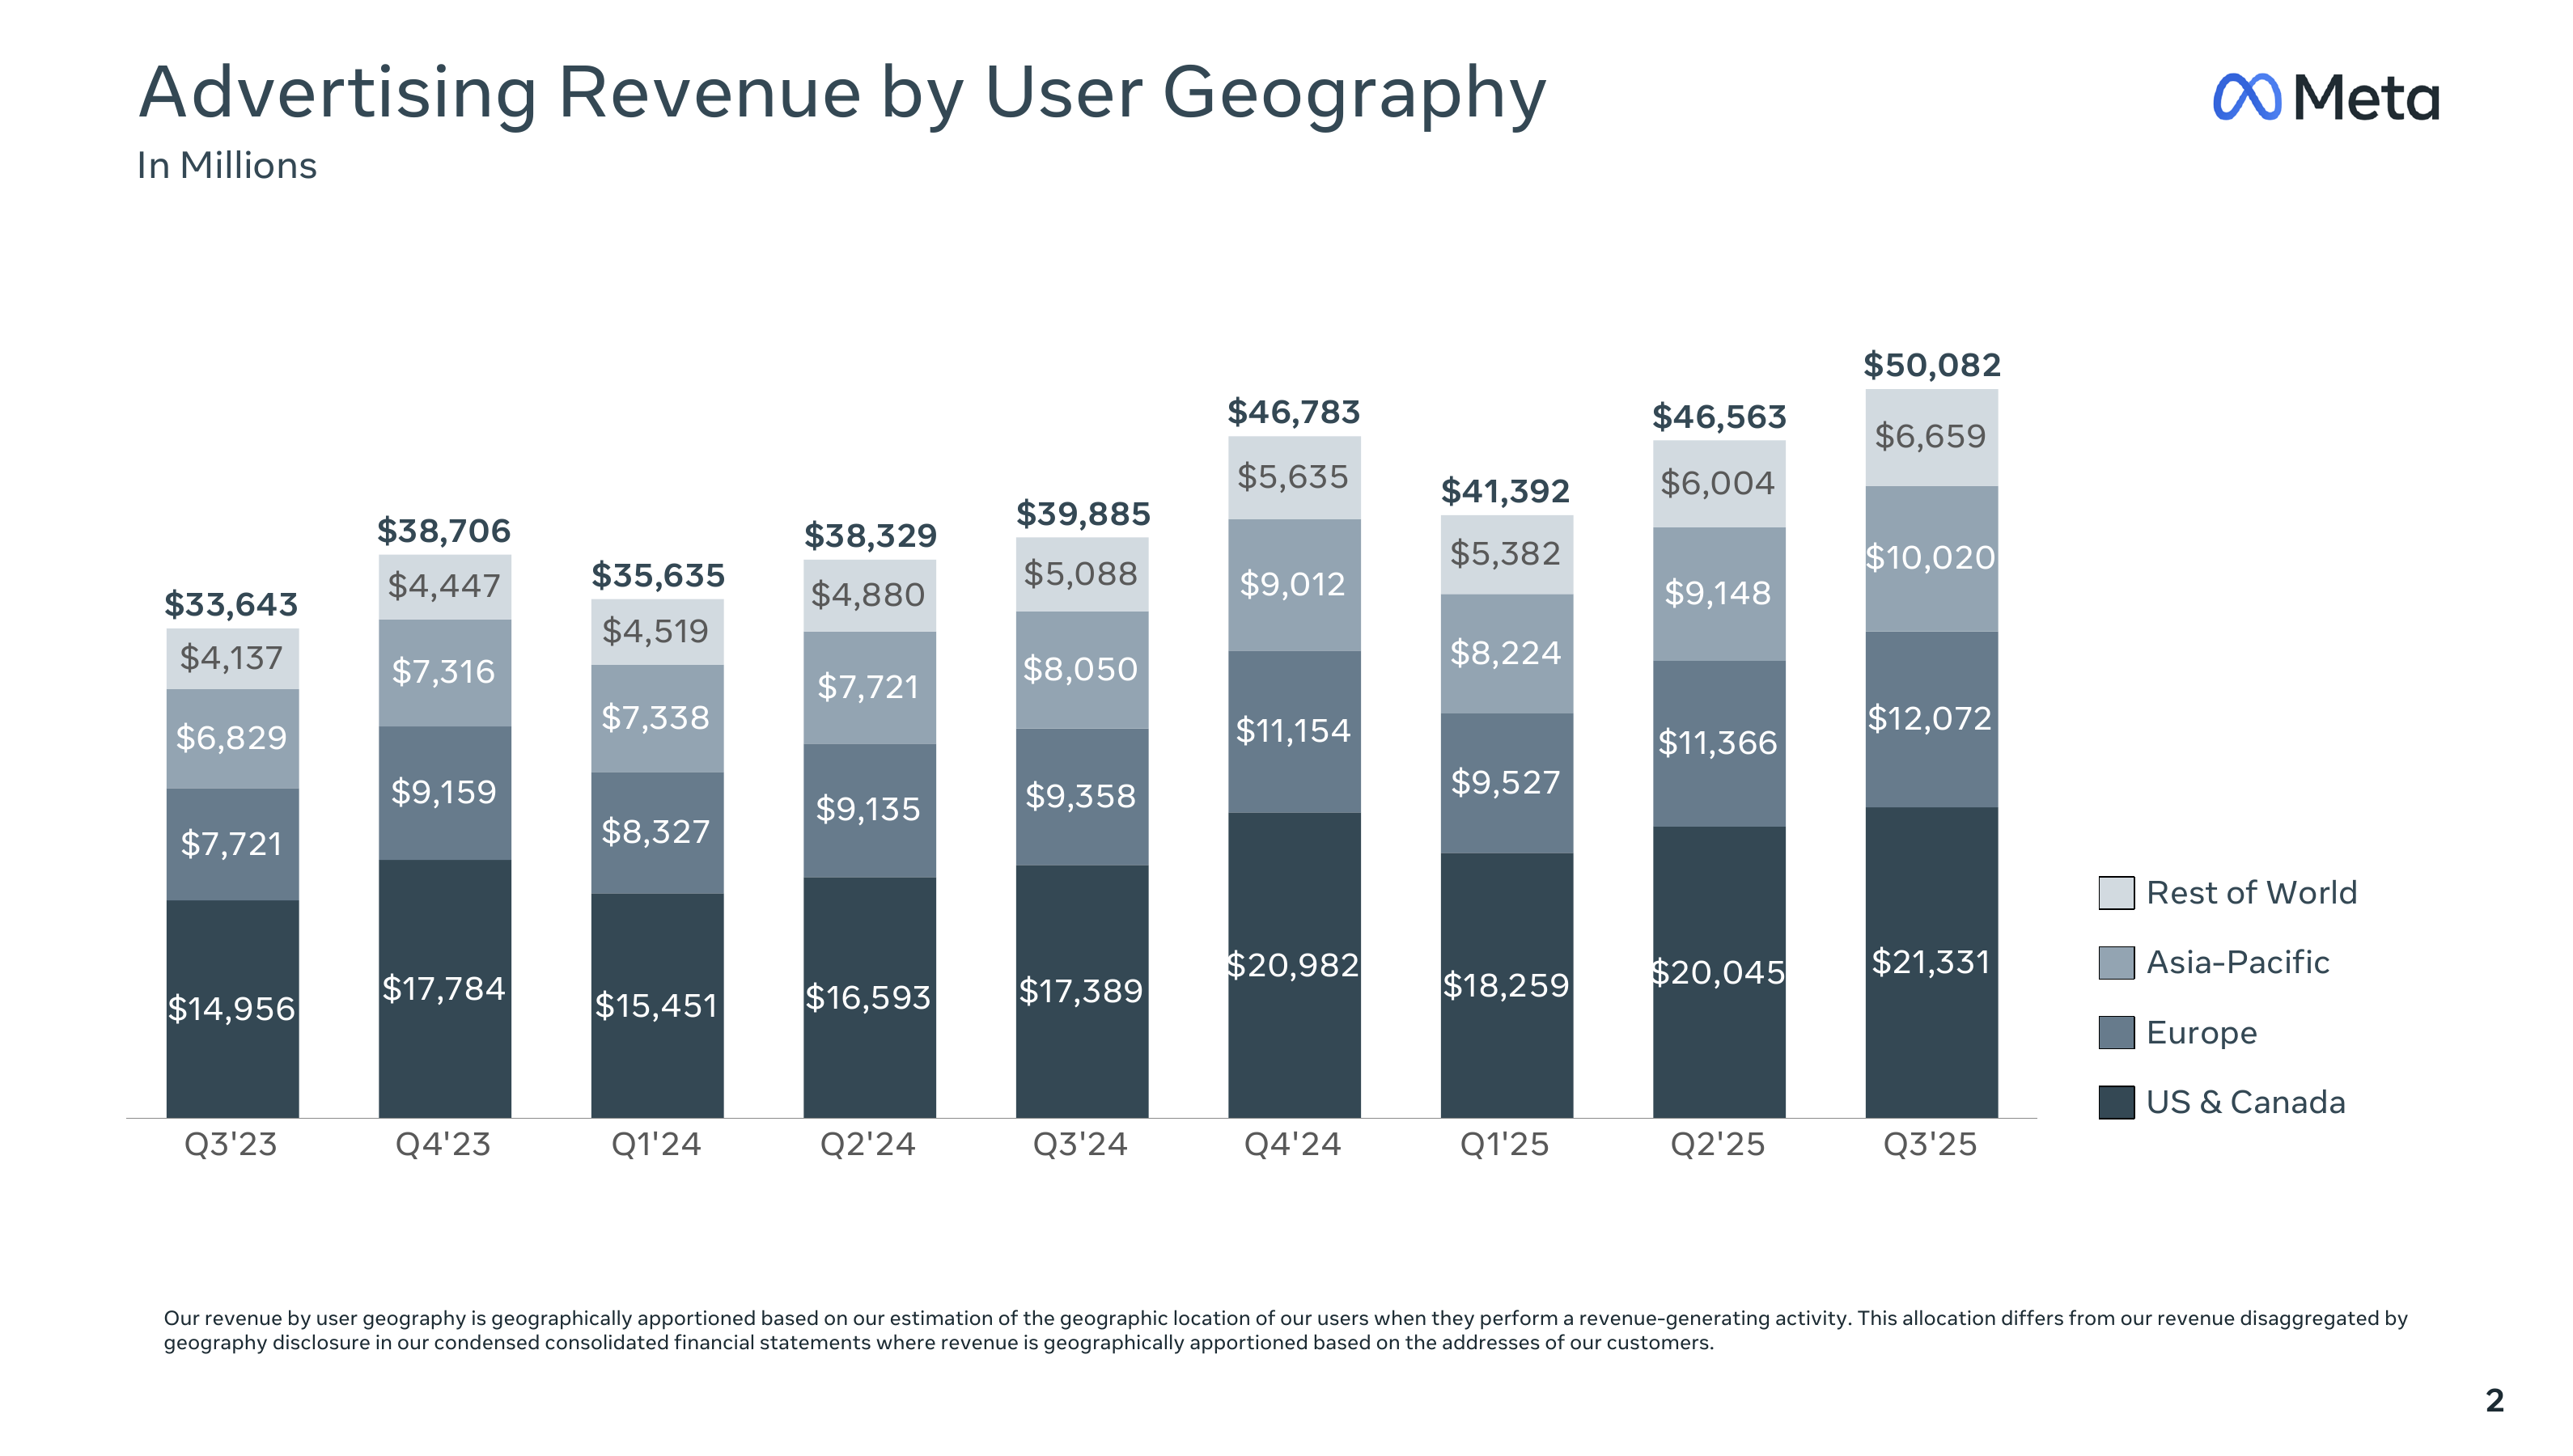
12 indexed recordsAvailable to searchCompany investor relations
Visual pages from a small set of official investor-relations PDFs.
13 indexed recordsSearch the sources available now, or contact us to scope a paid pilot against your team’s workflow.